

TL;DR:
- A food business dashboard consolidates real-time operational data to enhance decision-making. It tracks key metrics like food costs, sales, and waste, helping small businesses improve profitability. Focusing on actionable KPIs and limiting metrics prevents information overload and drives continuous growth.
A food business dashboard is a centralized digital tool that pulls real-time financial and operational data into one screen, giving food entrepreneurs a clear picture of how their business is performing right now. Think of it as the control panel for your culinary operation: sales figures, food costs, labor hours, and menu margins all visible at a glance. Without this kind of visibility, small food businesses often make decisions based on gut feeling rather than facts. That gap between intuition and data is exactly where profits disappear. This guide breaks down what a food business dashboard tracks, how it improves your bottom line, and how to set one up without getting lost in the numbers.
What is a food business dashboard and what does it track?
A food business dashboard is a business intelligence tool that consolidates data from multiple sources, including your point-of-sale system, inventory records, and labor schedules, into a single live view. The industry term for this type of tool is a BI dashboard (business intelligence dashboard). Unlike a traditional report that only describes what happened last week, a BI dashboard explains why and guides next steps. That shift from backward-looking data to real-time insight is what makes dashboards genuinely useful for running a food business day to day.

The core value is integration. Dashboards combining sales, inventory, and labor data reveal patterns that isolated spreadsheets never could. A spike in food cost that coincides with a scheduling gap becomes visible immediately, not three weeks later during a monthly review.
Understanding the role of dashboards in food business starts with knowing what data actually matters. The right dashboard tracks metrics that directly affect your profitability and daily operations.
What key metrics and KPIs does a food business dashboard track?
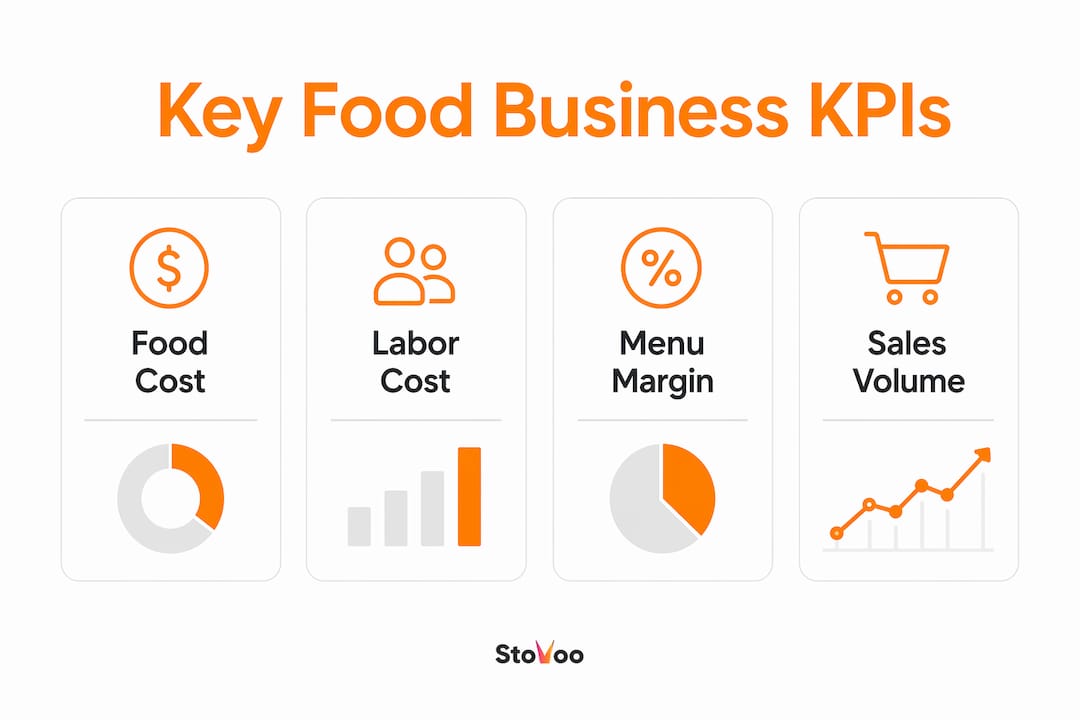
The best food business KPIs fall into five clear categories. Each one connects directly to a decision you make every day.
- Sales performance: Daily revenue, average order value, and peak sales periods. These numbers tell you when to staff up and which days need a promotional push.
- Food cost percentage: The ratio of ingredient cost to menu price. Most food businesses target a food cost percentage between 28% and 35%. Watching this metric live catches supplier price changes before they erode your margin.
- Food waste tracking: Spoilage rates by ingredient and by menu item. High waste on a specific dish often signals a portion control problem or a menu item that is not selling fast enough.
- Labor cost and scheduling efficiency: Labor as a percentage of revenue. When this number climbs unexpectedly, your dashboard flags it before it compounds across a full pay period.
- Menu item contribution margins: Which dishes actually make money after food and labor costs. A popular item with a thin margin can quietly drain profit while a less-ordered dish carries the business.
- Customer satisfaction signals: Repeat order rates, subscription renewals, and feedback scores. These metrics predict future revenue more reliably than any single sales figure.
Pro Tip: Track contribution margin by menu item, not just overall revenue. A dish that sells well but costs too much to produce can quietly pull your profit down week after week.
The power of these metrics multiplies when they feed into one view. A restaurant performance dashboard that connects your POS data to your inventory and labor records gives you a complete picture, not just a partial one.
How do food business dashboards improve efficiency and financial management?
The efficiency gains from digital management tools are well documented. Web-based management systems for culinary micro-businesses increased work efficiency by up to 68% and achieved a user satisfaction score of 85 out of 100. That is not a marginal improvement. It means a food entrepreneur spending 10 hours a week on admin could reclaim nearly 7 of those hours for cooking, selling, or growing their customer base.
The financial pressure driving dashboard adoption is real. Restaurant operating costs have increased approximately 30% since 2019, making real-time visibility a necessity rather than a luxury. When every dollar of margin counts, waiting for a weekly report to spot a labor overage is too slow.
Real-time data enables decisions during the day, not after it. Dashboards allow staff to discount near-expiration items to reduce waste before products spoil, a move that spreadsheets updated daily simply cannot support. That kind of timely action compounds over weeks and months into meaningful cost savings.
Pro Tip: Set a daily alert threshold for food cost percentage. If your dashboard shows food cost crossing 35% before noon, you still have time to adjust portion sizes or run a special before the day ends.
The role of dashboards in small food businesses goes beyond cost control. Consistent data visibility builds confidence. When you know your numbers, you make faster decisions and spend less time second-guessing yourself. You can read more about how food business digitalization supports this kind of operational confidence.
What common mistakes should small food businesses avoid with dashboards?
The biggest mistake is tracking too many metrics at once. Small food businesses should limit their dashboards to 5 or 6 actionable signals to avoid information overload and decision paralysis. More data does not mean better decisions. It often means no decision at all.
The second mistake is confusing decorative charts with useful information. Many dashboards show raw data without context or next steps. An effective dashboard answers three questions: What is happening now? What changed? What should I do next? If your dashboard cannot answer all three, it is not working hard enough for you.
Here are the most common pitfalls to avoid:
- Tracking vanity metrics: Total page views or social media followers feel good but do not connect to revenue or cost control.
- Ignoring mobile access: A dashboard you can only check from a desktop computer is useless during a busy service.
- Skipping context: A number without a benchmark is meaningless. Your food cost percentage needs a target to be useful.
- Feature bloat: Adding every available metric because it seems useful. Metrics that do not suggest a specific next step should be removed. If a metric does not tell you to reorder, adjust staffing, or change a price, it is a distraction.
- Set-and-forget thinking: A dashboard built in january and never updated stops reflecting your actual business within weeks.
The role of dashboards in food startups is especially critical because early-stage businesses have less margin for error. Getting your metrics right from the start builds habits that scale. For practical guidance on keeping operations tight, the ways to streamline meal prep operations resource covers this in detail.
How to implement a food business dashboard for your operation
Setting up a food business dashboard does not require a technical background. It requires clarity about what you need to know and discipline about what to leave out.
- Define your core operational areas. Start with the three areas that most directly affect your profit: food cost, labor cost, and sales volume. Add metrics only when you have a clear reason to track them.
- Connect your data sources. Link your POS system, inventory records, and scheduling tool to a central platform. Manual data entry defeats the purpose of real-time visibility.
- Prioritize mobile access. Food entrepreneurs are rarely sitting at a desk. Your dashboard needs to work on a phone during prep, service, and delivery.
- Set daily review habits. A dashboard only creates value when you look at it. Build a 5-minute morning check into your routine before service begins.
- Iterate based on what you actually use. After 30 days, remove any metric you have not acted on. Replace it with something that connects to a real decision.
The table below shows how dashboard priorities shift by business model.
| Business model | Top priority metrics | Key dashboard trigger |
|---|---|---|
| Weekly meal prep | Food cost %, subscription renewals | Alert when food cost exceeds target |
| Catering operation | Labor cost %, booking conversion | Alert when labor exceeds revenue ratio |
| Digital recipe sales | Download volume, refund rate | Alert when refund rate rises |
| Food market vendor | Daily revenue, waste rate | Alert when waste exceeds daily threshold |
The role of dashboards in small food businesses becomes clearest when the tool matches the business model. A catering chef and a meal prep entrepreneur track different things. Your dashboard should reflect your specific operation, not a generic restaurant template.
Key Takeaways
A food business dashboard delivers real value only when it tracks a focused set of actionable metrics tied directly to daily operational decisions.
| Point | Details |
|---|---|
| Define it correctly | A food business dashboard is a BI tool providing real-time financial and operational visibility in one view. |
| Limit your metrics | Track only 5–6 actionable KPIs to avoid decision paralysis and keep focus sharp. |
| Act on real-time data | Live dashboards enable same-day corrections to food waste, labor, and pricing that daily reports cannot. |
| Match metrics to your model | Meal prep, catering, and digital sales businesses each need different dashboard priorities. |
| Avoid decorative data | Every metric must answer what is happening, what changed, and what to do next. |
The metric that actually changed how I think about dashboards
Most food entrepreneurs I have spoken with build their first dashboard by adding every metric they can find. The result looks impressive and tells them almost nothing useful. The turning point comes when they strip it back to the three or four numbers that connect directly to a decision they make every day.
The insight that shifted my thinking was simple: a metric with no attached action is just noise. If your food cost percentage rises above your target and your dashboard does not prompt you to do something specific, that number is decorating your screen, not running your business. The actionable metric philosophy is not a design preference. It is the difference between a tool that changes behavior and one that gets ignored after two weeks.
Food entrepreneurs also underestimate how much a dashboard changes team culture. When your staff can see the numbers, they start thinking about the numbers. A prep cook who knows the food cost target for the week makes different decisions about portion sizes than one who has no idea. Visibility creates accountability without a single difficult conversation.
My honest recommendation: start with three metrics, master them for 30 days, then add one more. Build the habit before you build the complexity. The food business admin tasks that eat your time are almost always symptoms of missing visibility, not missing effort.
— freeman
How Stovoo helps food entrepreneurs build real visibility
Running a food business without a clear view of your numbers is like cooking without tasting. Stovoo gives food creators, meal preppers, and catering chefs a centralized platform where orders, subscriptions, customer data, and revenue all live in one place.
Stovoo is built for the way small food businesses actually operate: mobile-first, fast to set up, and focused on recurring revenue. You get automated billing, customer management, and a professional shopfront you can share across WhatsApp, Instagram, and beyond. No spreadsheets. No chasing payments. Just a clear picture of your business and the tools to grow it. Start building your food business on Stovoo today and see what running with real visibility feels like.
FAQ
What is a food business dashboard?
A food business dashboard is a digital tool that consolidates real-time data on sales, food costs, labor, and customer activity into a single view. It helps food entrepreneurs make faster, better-informed operational decisions.
What are the best food business KPIs to track?
The most effective KPIs for food businesses are food cost percentage, labor cost percentage, menu item contribution margin, daily revenue, and customer repeat rate. Limiting your dashboard to 5–6 of these signals prevents information overload.
How does a dashboard differ from a regular report?
A traditional report describes what happened in the past, while a BI dashboard explains why it happened and suggests what to do next. That real-time guidance is what makes dashboards more useful for daily operations.
Can a small food business benefit from a dashboard?
Web-based management systems for culinary micro-businesses have increased work efficiency by up to 68%, making dashboards highly relevant even for solo operators and small teams.
How do I avoid information overload on my dashboard?
Track only metrics that suggest a specific next step, such as reordering stock, adjusting staffing, or discounting a near-expiry item. Remove any metric you have not acted on within 30 days.