
Average order value (AOV) is the total revenue a food business collects divided by the number of orders in a given period. It tells you how much each customer spends per transaction, and it's often a faster growth lever than chasing new customers because it turns your existing order volume into more revenue without adding acquisition cost. This article walks through the formula, why AOV shapes delivery-app visibility, and the specific tactics that move the number.
TL;DR:
- Raising the net AOV by about $2.50 through discounts or promos can improve profitability if it covers marketing and platform fees.
- Setting strategic minimum order thresholds around current AOV encourages customers to add items without deterring orders.
- Testing simple tactics like modifier defaults and checkout upsells can increase AOV without risking a drop in order volume.
- Focusing on net revenue and margin, not just gross sales, ensures that AOV improvements translate into actual profit.
- Using a centralized platform like Stovoo streamlines managing bundles, subscriptions, and higher-value orders to sustainably boost AOV.
Table of Contents
- What Is Average Order Value for Food Businesses, and How Do You Calculate It?
- Why AOV Matters Beyond the Revenue Line
- How Do You Actually Raise Average Order Value on Delivery and Pickup?
- Tracking AOV: KPIs, Dashboards, and a Sample Calculation
- What's a Good Average Order Value for a Food Business?
- Sequencing AOV Experiments Without Blowing Up Conversion
- Turning AOV Tactics Into a System With Stovoo
- Sources
- FAQ
What Is Average Order Value for Food Businesses, and How Do You Calculate It?
The formula is simple: AOV = total revenue ÷ number of orders. A food truck that brings in $3,000 from 150 orders in a week has an AOV of $20. That's the whole equation, but the details around it are where most operators get sloppy.
Two distinctions matter before you trust the number:
- Net vs. gross revenue. Gross AOV counts the sticker price of every order. Net AOV subtracts discounts, refunds, comped items, and delivery-platform commissions. Use net AOV when you're deciding whether a promotion actually paid off, because a "successful" $5-off deal can quietly shrink your real revenue per order.
- Pick a consistent window and channel filter. Calculate AOV separately for delivery, pickup, and dine-in if you run all three. A pizza shop blending its $12 delivery average with its $45 catering average gets a meaningless blended number that hides where the real opportunity sits.
Here's a worked example. Say a fast-casual restaurant logs $8,400 in delivery revenue over a 30-day month, spread across 280 orders. Gross AOV comes out to $30. Now subtract $650 in refunds and discount codes: net revenue is $7,750, and net AOV drops to about $27.68. That gap, nearly $2.50 per order, is the real number that should guide whether last month's promo calendar was worth running again. Operational calculators built for restaurants automate this math directly from POS exports, which saves you from rebuilding the same spreadsheet every reporting cycle.
Why AOV Matters Beyond the Revenue Line
A higher AOV means more revenue from the same customer base, which directly improves your customer acquisition cost payback. If it costs $15 in ads and delivery-platform fees to win a new customer, a $22 AOV order pays that back almost immediately. An $18 AOV order might not, especially after commissions.
Delivery platforms also factor order economics into how they rank merchants, highlighting the role of online food ordering in modern restaurant operations. Businesses that generate more revenue per transaction tend to get more favorable placement and promotional support, because platforms are optimizing for their own take on total transaction value, not just order count. That's a strong reason to treat AOV as a visibility lever, not just a bookkeeping metric.
There's a real trade-off to watch, though. Pushing AOV too aggressively, through high minimums or aggressive upsell prompts, can suppress conversion rate and order frequency. Commentary from the Bureau of Labor Statistics on household spending patterns underscores how sensitive consumer behavior is to price friction, especially when budgets tighten. The goal isn't the highest possible AOV. It's the highest total revenue per customer over time, factoring in how often they come back. A customer who orders twice a week at $18 often beats one who orders once a month at $35.
How Do You Actually Raise Average Order Value on Delivery and Pickup?
Delivery and pickup orders operate under constraints dine-in doesn't: packaging costs, food that has to survive a 20-minute ride, and a checkout screen where every extra tap costs you conversion. The tactics below are ranked roughly by how fast you can test them.
Menu engineering comes first because it costs nothing to implement. Anchor your menu with one clearly premium item near the top of each category, since it resets the customer's sense of what "normal" pricing looks like and makes mid-tier items feel like the smart choice. Price bands (a $12, $18, and $26 entrée tier, for example) do the same work. BLS regional consumer expenditure data supports this kind of combo and anchor pricing as a legitimate lever for nudging average spend upward, not just a restaurant-industry myth.
Modifier architecture is the highest-leverage lever most operators ignore. Default add-ons (a size upgrade pre-selected instead of opt-in) consistently outsell the same option presented as a checkbox. Suggested pairings placed right after the main item, not buried in a separate menu tab, catch customers while they're still in a spending mindset.
Bundles need to be built for delivery, not adapted from dine-in menus. A bundle that includes a side that gets soggy in 20 minutes will hurt your reviews faster than it helps your AOV. Design combos around items that travel well and protect your margin after packaging costs, which is a packaging-and-perishability trade-off dine-in menus never have to solve.
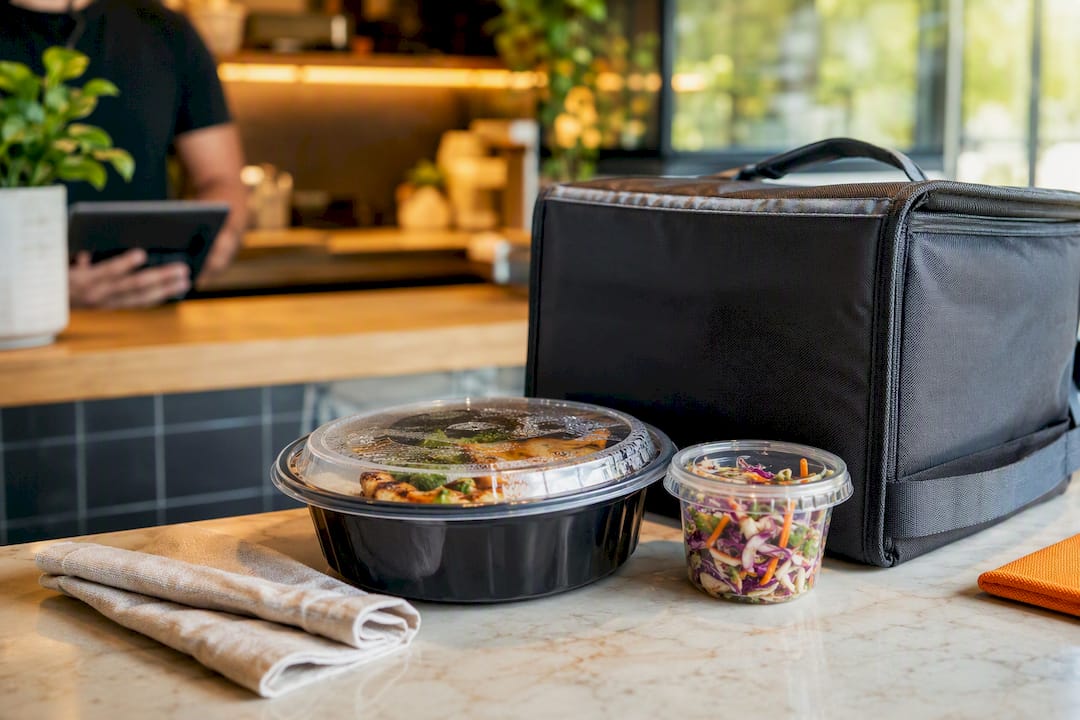
Minimum order thresholds and free-delivery breakpoints work, but calibrate them carefully. A $25 free-delivery threshold on a menu with a $19 average ticket pushes a meaningful share of customers to add one more item. Set the threshold too high above your current AOV and you'll lose orders instead of growing them.
Other proven levers, drawn in part from Uber Eats' own merchant guidance on this exact problem:
- Checkout-page upsells ("add a drink for $2") on both platform apps and your own webstore
- Loyalty programs that reward order size, not just visit frequency
- Subscription or recurring-order models that lock in a higher baseline spend automatically
Pro Tip: Test one variable at a time. If you launch a new bundle and a new minimum threshold in the same week, you won't know which one moved the number, and you won't know which one to roll back if conversion drops.
Before rolling any tactic out storewide, run it against a testing checklist: confirm packaging cost per bundle, check that staffing can handle any prep-time increase, and set a rollback trigger (typically a conversion-rate drop past a set threshold) before you launch, not after.
Tracking AOV: KPIs, Dashboards, and a Sample Calculation
Six numbers belong on every food business dashboard: AOV, total orders, total revenue, conversion rate, repeat-order rate, and gross margin. Tracking AOV alone without margin is how operators accidentally celebrate a "win" that actually lost money on packaging or discounts.
Net AOV is the number that should drive decisions, and it requires a bit more math than the gross figure:
- Start with gross revenue for the period.
- Subtract discounts, refunds, and comped orders.
- Subtract delivery-platform commissions if you're calculating true take-home AOV rather than storefront AOV.
- Divide the result by total order count for that same period.
A practical reporting cadence looks like this: a daily sales summary for quick pulse checks, a weekly trend view to catch a tactic that's underperforming before it costs you a full month, and a monthly goal review where you compare actual AOV against target. Daily sales summary tools built for restaurants typically flag orders with discounts or refunds automatically, which matters because manual tracking tends to undercount how much promotions are actually costing you.
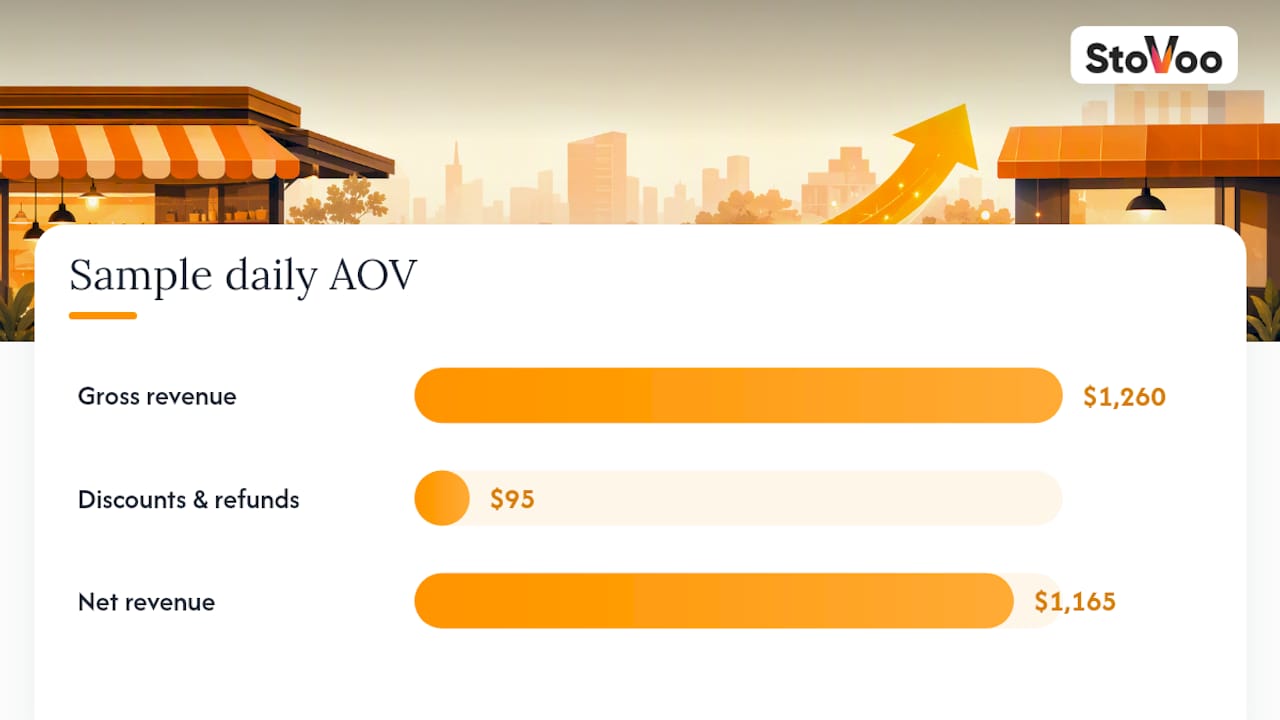
Here's a sample walkthrough you can drop into a spreadsheet: 42 orders in a day, $1,260 gross revenue, $95 in discounts and refunds. Net revenue is $1,165. Net AOV: $1,165 ÷ 42 = $27.74. Run that same calculation weekly and you'll spot drift long before it shows up in a monthly P&L.
What's a Good Average Order Value for a Food Business?
AOV ranges swing hard by concept and channel, so a single benchmark number is close to useless without context. Category data from Restolabs' platform transaction analysis puts the broader online-ordering average around $38.96, with sandwich and deli concepts running higher and high-volume categories like pizza typically landing lower per ticket despite strong order counts.
A workable heuristic: set your target some percentage above your current AOV, then adjust based on your margin structure and how sensitive your conversion rate is to price friction. A modest increase target is achievable through one well-placed bundle or a modifier default change, without needing a menu overhaul.
Sequencing AOV Experiments Without Blowing Up Conversion
The order you test tactics in matters more than most operators realize. Start with modifier defaults and checkout-page upsells: near-zero cost, reversible in a day, and they rarely scare off a customer mid-order. Save bundle redesigns and minimum-order thresholds for after you've built confidence, because those changes touch packaging, pricing perception, and sometimes staffing.
The most common pitfall isn't a bad idea. It's running three changes at once and having no way to tell which one tanked conversion. A close second: raising a minimum threshold without checking whether it sits above what your typical customer already spends.
Before any launch, confirm packaging cost, staff readiness, and a clear rollback number. Success looks like AOV climbing while conversion rate and repeat-order rate hold steady, not one metric improving while the other quietly erodes.
— freeman
Turning AOV Tactics Into a System With Stovoo
Every tactic above (bundles, modifier defaults, recurring orders) requires a shopfront that can actually execute them without you rebuilding your menu in three different apps every time you test something new. Stovoo gives food creators, meal preppers, and small food businesses one dashboard to manage subscription meal plans, catering bookings, and digital recipe sales, instead of juggling spreadsheets and group chats to track what customers ordered and owe.
Setting up a bundle or a weekly meal-plan subscription inside Stovoo takes minutes, and because billing runs automatically, you're not manually chasing payments every time a customer renews. That matters directly for AOV: recurring orders raise your baseline spend per customer without a single new upsell prompt, because the higher-value commitment is built into the plan itself. If you're currently piecing together bundles and modifiers across a delivery app and a separate ordering link, a Stovoo shopfront consolidates that into one page you can share anywhere. Ready to test a subscription tier or a catering package built for higher order value? Create your account and start selling in one place.
Sources
For further reading: the USDA's Food Dollar data, Restolabs' ordering benchmarks, and Stovoo's guide on boosting food sales cover the data and tactics referenced throughout this piece.
- Food ordering statistics & restaurant benchmarks — Restolabs
- AOV (Average Order Value) Calculator — CalcMastery
FAQ
What Is an Average Order Value?
Average order value is total revenue divided by total number of orders in a given period, measuring how much a customer spends per transaction on average.
What Is the 30/30/30 Rule for Restaurants?
The 30/30/30 rule generally refers to allocating roughly a third of revenue each to food cost, labor cost, and overhead/profit; it's a budgeting framework rather than a direct AOV metric, though healthier margins from that split give you more room to test AOV-boosting bundles.
What's the Most Ordered Food in America?
Order patterns vary widely by platform and region, but sandwich and deli items rank among the higher-AOV categories in platform transaction data, while pizza tends to drive high order volume at a comparatively lower average ticket.
What Is AOV and LTV?
AOV measures revenue per individual order, while lifetime value (LTV) measures total revenue a customer generates across every order over their entire relationship with your business; raising AOV is one of the direct ways to grow LTV, especially when paired with a recurring-order model like a subscription plan.